


CAD Productivity Metrics That Matter on the Shop Floor
CAD Productivity Metrics are the clearest way to understand how efficiently engineering intent moves from design to manufacturing. Unlike activity-based indicators, they focus on real outcomes such as time saved, errors avoided, and effort removed from daily workflows.
Many organizations still rely on surface-level measurements like model counts or CAD usage hours. These numbers show activity, but they rarely explain why programs slip, manufacturing waits, or rework appears late.
Outcome-driven measurement shifts attention from how CAD is used to how engineering value actually flows across teams, systems, and the shop floor.
Why Traditional Productivity Measurements Fall Short
Commonly tracked indicators include:
- Number of models created
- Feature or command counts
- Time logged inside CAD software
- Automation scripts executed
While easy to capture, these indicators fail to reflect real engineering throughput. Meaningful CAD Productivity Metrics instead focus on how quickly designs become manufacturing-ready without late corrections, clarifications, or downstream firefighting.
Clicks vs Time: What Should Really Be Measured
A single unnecessary click feels insignificant. But when repeated across hundreds of features, multiple validation steps, and several design iterations, seconds quietly accumulate into hours.
Effective engineering performance measurement looks at:
- Minutes saved per design task
- Time avoided in rework cycles
- Reduction in design–manufacturing back-and-forth
Clicks do not impact delivery dates. Lost minutes do — especially when multiplied across teams, programs, and product variants.
How Productivity Issues Appear on the Shop Floor
On the shop floor, inefficiencies rarely appear as CAD problems. Instead, they surface as:
- Waiting for corrected or clarified models
- Missing parameters or unclear design intent
- Geometry that passed design checks but failed manufacturing reality
- Manual validation that should have been automated
These delays are operational symptoms of upstream design inefficiencies. CAD Productivity Metrics help trace these issues back to their real source instead of treating them as isolated manufacturing problems.
Where Engineering Time Is Lost Without Being Noticed
Most time loss in CAD environments is silent and normalized:
- Manually checking standards and naming conventions
- Remembering company-specific modeling rules
- Rebuilding similar features repeatedly
- Validating designs after modeling instead of during creation
Engineers adapt to these inefficiencies and often stop noticing them. Structured measurement makes this hidden loss visible, measurable, and addressable at a system level.
How CitiusKBE Measures Engineering Efficiency Differently
Most initiatives attempt to make engineers work faster. CitiusKBE focuses on removing unnecessary work altogether.
Instead of asking, “How can this be done faster?”, the question becomes:
“Why should this be done manually at all?”
This philosophy is implemented through:
- Embedded quality checks inside Siemens NX
- Automation driven by company-specific engineering rules
- Validation that occurs during modeling, not after
- Alignment with Knowledge-Based Engineering principles
Internal tools such as
QC-Mate NX and
StandardMate NX support this outcome-driven approach by converting engineering standards into executable logic.
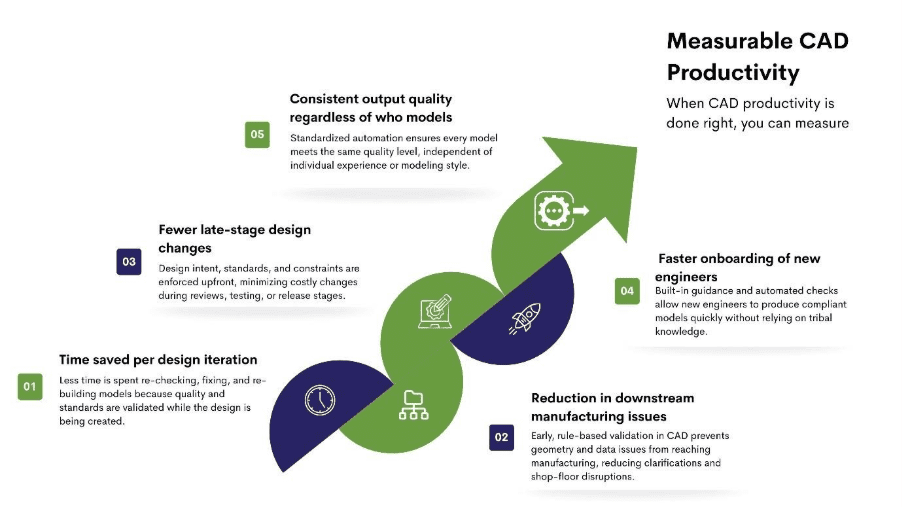
What Good Measurement Looks Like in Practice
When productivity is measured correctly, organizations can track:
- Time saved per design iteration
- Reduction in downstream manufacturing issues
- Fewer late-stage design changes
- Faster onboarding of new engineers
- Consistent output quality across teams
These indicators reflect real engineering flow rather than software activity, making them actionable for both engineering leadership and manufacturing teams.
The Business Impact
Organizations using outcome-based CAD Productivity Metrics achieve:
- Shorter design-to-release cycles
- More predictable engineering timelines
- Stronger trust between design and manufacturing
- Less reliance on individual “CAD heroes”
As a result, productivity becomes scalable, repeatable, and resilient — not dependent on individual effort or tribal knowledge.
Final Thought
If engineers feel overloaded, interrupted, or constantly correcting work, productivity dashboards are missing the truth.
Real efficiency is felt through fewer interruptions, fewer corrections, and fewer “we’ll fix it later” moments.
Stop counting clicks. Start reclaiming minutes.